Hi friends,
In the previous post under the series of posts under Data Science & Machine Learning, we learnt how to fill in the missing values in the Pandas DataFrames. In this post, we will see the SQL functionalities of Groupby, Merge and Join supported by Pandas DataFrames.
Note: All the commands discussed below are run in the Jupyter Notebook environment. See this post on Jupyter Notebook to know about it in detail.
Pandas SQL Functionalities
So, let's begin with the Groupby functionality first. Groupby helps in grouping large data frames by different columns and applying summary functions on each group. Let's go through an example now to understand it better.
In the above example taken from here, we can see that the first table is grouped based on the column state and then various aggregate function like the max(), min() and average() and applied on it.
Let's now go through some examples using Jupyter Notebook. So, let's first create a sample DataFrame.
In the sample DataFrame created above, we have four columns namely, company, name, profile and CTC. Now, if we want to compute the average CTC of employees based on the company column then we would do the following:
We can also find the average CTC based on the profile:
We can also apply other aggregate functions like sum(), standard deviation (std), min(), max(), etc.
Pandas provide a describe() method that lists these basic measures all together:
Let's now see the concatenate and join operations on DataFrames. Before we can perform the concatenate and join operations, we first need to create a couple of sample DataFrames.
Now, we concatenate these two DataFrames using the concat() method:
Notice that the DataFrames are concatenated along the rows by default. We can concatenate them along the columns as well by setting axis parameter to 1.
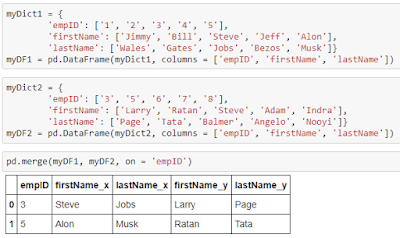
We can also merge the two columns based on the SQL notion of join operation using the merge() method by providing the key parameter:


0 comments:
Post a Comment