Monday, 13 April 2026

First Bad Version

You are a product manager and currently leading a team to develop a new product. Unfortunately, the latest version of your product fails the quality check. Since each version is developed based on the previous version, all the versions after a bad version are also bad.
Suppose you have n versions [1, 2, ..., n] and you want to find out the first bad one, which causes all the following ones to be bad.
You are given an API bool isBadVersion(version) which will return whether version is bad. Implement a function to find the first bad version. You should minimize the number of calls to the API.
Approach : Use binary search to find the lowest bad version.


 1
 2
 3
 4
 5
 6
 7
 8
 9
10
11
12
13
14
15
16
17
18
19
20
21
22
23
// Forward declaration of isBadVersion API.
bool isBadVersion(int version);

int first(int low, int high){
    if(isBadVersion(low)){
        return low;
    }
    int mid = low + (high - low) / 2;
    //if it is the first bad version or the version before it is not a bad version then return this version
    if((mid == 0 || !isBadVersion(mid - 1)) && isBadVersion(mid)){
        return mid;
    }else if(isBadVersion(mid)){
        //find a smaller bad version
        return first(low, mid - 1);
    }else{
        //find a larger bad version
        return first(mid + 1, high);
    }
}

int firstBadVersion(int n) {
    return first(0, n - 1);
}
Share:

Saturday, 12 February 2022

Product of Array Except Self

Given an array of n integers where n > 1, nums, return an array output such that output[i] is equal to the product of all the elements ofnums except nums[i].
Solve it without division and in O(n).
For example, given [1,2,3,4], return [24,12,8,6].
Approach:
The idea is to traverse the array couple of times from left to right once and right to left once keeping track the accumulated product so far from both the sides. 


 1
 2
 3
 4
 5
 6
 7
 8
 9
10
11
12
13
14
15
16
17
18
19
20
21
/**
 * Return an array of size *returnSize.
 * Note: The returned array must be malloced, assume caller calls free().
 */
vector<int> productExceptSelf(vector<int> &nums) {
    int numsSize = nums.size();
    vector<int> result(numsSize);
    int temp = 1;
    // stores the product on the left of each element excluding itself
    for(int i = 0; i < numsSize; i++){
        result[i] = temp;
        temp = temp * nums[i];
    }
    temp = 1;
    // stores the product on the left times product on right of each element excluding itself
    for(int i = numsSize - 1; i >= 0; i--){
        result[i] = result[i] * temp;
        temp = temp * nums[i];
    }
    return result;
}
Share:

Saturday, 22 January 2022

Reverse String

Write a function that takes a string as input and reverse the same.
Example:
Given s = "hello", return "olleh".
Approach: The idea is to swap the last and the first characters till the middle is reached.

 1
 2
 3
 4
 5
 6
 7
 8
 9
10
11
string reverseString(string &s) {
    int low = 0, high = s.length() - 1;
    while(low < high){
        char t = s[low];
        s[low] = s[high];
        s[high] = t;
        low++;
        high--;
    }
    return s;
}  
Share:

Saturday, 8 January 2022

Reverse Vowels of a String

Write a function that takes a string as input and reverse only the vowels of a string.
Example 1:
Given s = "hello", return "holle".
Approach:  The idea is to traverse the string from both ends while skipping the non-vowels characters from both ends.

 1
 2
 3
 4
 5
 6
 7
 8
 9
10
11
12
13
14
15
16
17
18
19
20
21
22
char* reverseVowels(char* s) {
    int low = 0, high = strlen(s) - 1;
    char c;
    while(low < high){
        //move forward to skip consonant
        while(low < strlen(s) && tolower(s[low]) != 'a' && tolower(s[low]) != 'e' && tolower(s[low]) != 'i' && tolower(s[low]) != 'o' && tolower(s[low]) != 'u'){
            low++;
        }
        //move backward to skip consonant
        while(low < high && tolower(s[high]) != 'a' && tolower(s[high]) != 'e' && tolower(s[high]) != 'i' && tolower(s[high]) != 'o' && tolower(s[high]) != 'u'){
            high--;
        }
        if(low < high){
           c = s[low];
           s[low] = s[high];
           s[high] = c;
           low++;
           high--;
        }
    }
    return s;
}
Share:

Monday, 4 October 2021

Move Zeros

Given an array nums, write a function to move all 0's to the end of it while maintaining the relative order of the non-zero elements.
For example, given nums = [0, 1, 0, 3, 12], after calling your function, nums should be [1, 3, 12, 0, 0].
Note:
  1. You must do this in-place without making a copy of the array.
  2. Minimize the total number of operations.


 1
 2
 3
 4
 5
 6
 7
 8
 9
10
11
12
13
14
void moveZeroes(int* nums, int numsSize){
    int i = 0, j = 0;
    for(i = 0; i < numsSize; i++){
        //copy non-zero elements
        if(nums[i] != 0){
            nums[j] = nums[i];
            j++;
        }
    }
    //put zeros in the end
    while(j < numsSize){
        nums[j++] = 0;
    }
}
Share:

Sunday, 12 September 2021

Find Peak Element

A peak element is an element that is greater than its neighbors.
Given an input array where num[i] ≠ num[i+1], find a peak element and return its index.
The array may contain multiple peaks, in that case return the index to any one of the peaks is fine.
You may imagine that num[-1] = num[n] = -∞.
For example, in array [1, 2, 3, 1], 3 is a peak element and your function should return the index number 2.
Approach: Use binary search.

 1
 2
 3
 4
 5
 6
 7
 8
 9
10
11
12
13
14
15
16
17
18
19
20
21
22
23
24
25
26
int peakIndex(int *arr, int low, int high){
    if(low == high){
        return low;
    }
    if(low + 1 == high){
        if(arr[low] >= arr[high]){
            return low;
        }else{
            return high;
        }
    }
    int mid = (low + high) / 2;
    if(arr[mid] > arr[mid - 1] && arr[mid] > arr[mid + 1]){
        return mid;
    }else if(arr[mid] < arr[mid - 1]){
        //peak lies on the left since arr[mid - 1] > arr[mid] && arr[0] = -infinity so there has to be an element which is peak on the left
        return peakIndex(arr, low, mid - 1);
    }else{
        //peak lies on the right
        return peakIndex(arr, mid + 1, high);
    }
}

int findPeakElement(int* nums, int numsSize) {
    return peakIndex(nums, 0, numsSize - 1);
}
Share:

Tuesday, 7 September 2021

Valid Palindrome

Given a string, determine if it is a palindrome, considering only alphanumeric characters and ignoring cases.
For example, "A man, a plan, a canal: Panama" is a palindrome.
"race a car" is not a palindrome.


 1
 2
 3
 4
 5
 6
 7
 8
 9
10
11
12
13
14
15
16
17
18
19
20
bool isPalindrome(char* s) {
   int i, j, len;
   len = strlen(s);
   i = 0; j = len - 1;
   while(i < j){
       // skip non alpha chars from start
       while(i < len && !isalnum(s[i])){
           i++;
       } 
       // skip non alpha chars from end
       while(j >= 0 && !isalnum(s[j])){
           j--;
       } 
       if(i < j && tolower(s[i]) != tolower(s[j])){
           return false;
       } 
       i++;
       j--;
   }
   return true;
}
Share:

Sunday, 1 August 2021

Balanced Binary Tree

Given a binary tree, determine if it is height-balanced.
For this problem, a height-balanced binary tree is defined as a binary tree in which the depth of the two subtrees of every node never differ by more than 1.

 1
 2
 3
 4
 5
 6
 7
 8
 9
10
11
12
13
14
15
16
17
18
19
20
21
22
23
24
25
26
27
28
29
30
31
32
33
34
35
36
37
38
39
/**
 * Definition for a binary tree node.
 * struct TreeNode {
 *     int val;
 *     TreeNode *left;
 *     TreeNode *right;
 *     TreeNode(int x) : val(x), left(NULL), right(NULL) {}
 * };
 */
class Solution {
public:
    int height(TreeNode *root){
        if(root == NULL){
            return 0;
        }
        int leftHeight = height(root->left);
        if(leftHeight == -1){
            return -1;
        }
        int rightHeight = height(root->right);
        if(rightHeight == -1){
            return -1;
        }
        if(abs(leftHeight - rightHeight) > 1){
            return -1;
        }
        return 1 + max(leftHeight, rightHeight);
    }
    
    bool isBalanced(TreeNode* root) {
        if(root == NULL){
            return true;
        }
        if(height(root) == -1){
            return false;
        }
        return true;
    }
};
Share:

Thursday, 29 July 2021

Leaders in an array

An element is leader if it is greater than all the elements to its right side. And the rightmost element is always a leader.
For example int the array {16, 17, 4, 3, 5, 2}, leaders are 17, 5 and 2.


 1
 2
 3
 4
 5
 6
 7
 8
 9
10
11
12
13
14
15
16
17
#include <iostream>
using namespace std;

int main(){
    int arr[] = {18, 16, 17, 4, 3, 5, 2};
    int n = sizeof(arr)/sizeof(arr[0]);
    int maxSoFar = arr[n - 1];
    cout << maxSoFar << " ";
    for(int i = n - 2; i >= 0 ; i--){
        if(arr[i] > maxSoFar){
            cout << arr[i] << " ";
            maxSoFar = arr[i];
        }
    }
    cout << endl;
    return 0;
}
Share:

Sunday, 7 February 2021

Getting rollout status of Kubernetes Deployment object

With kubectl rollout status deployment deployment-name, you can check the rollout status of a Kubernetes Deployment deployment-name. If the rollout completes successfully, kubectl rollout status returns a zero exit code otherwise a non-zero exit code is returned.

Assuming, we have a Deployment name app with three replicas and we updated the Deployment with a new image.

Running the kubectl rollout status deployment/app will show the following output if the pods get updated without errors:

kubectl rollout status deployment app
Waiting for deployment "app" rollout to finish: 0 of 3 updated replicas are available…
Waiting for deployment "app" rollout to finish: 1 of 3 updated replicas are available…
Waiting for deployment "app" rollout to finish: 2 of 3 updated replicas are available…
deployment "app" successfully rolled out

We can also specify how long Kubernetes should wait for deployment to progress until it declares the rollout as a failure. Kubernetes marks the deployment status as failed if the deployment doesn't succeed until the deadline is met which the rollout status command uses to return its output.

We see logs similar to the below logs for a failed rollout:

kubectl rollout status deployment app
Waiting for deployment "app" rollout to finish: 1 out of 3 new replicas have been updated…
error: deployment "app" exceeded its progress deadline
Using the above concepts, the answers to your questions will be:

How to make sure the new deployment succeed?

kubectl rollout status deployment <deployment-name> will return with zero exit code which you can use to verify that the deployment was successful.

How to make the the new deployment failed?

kubectl rollout status deployment <deployment-name> will return with non-zero exit code which you can use to verify that the deployment has failed.

Is it safe to assume that if the spec/containers/0/image changes to something different than what I'm expecting, it means there is a new deployment and I should stop watching?

Kubernetes does not create a new Deployment object after the modification but it updates the existing one with the new changes. Deployment internally creates a new ReplicaSet object which creates new set of pods for rolling out new changes. You can use the same kubectl rollout status deployment <deployment-name> command to track the status of the new Deployment.

Share:

Saturday, 22 August 2020

Data Science & Machine Learning - 7.2 Seaborn Distribution Plots

Hi friends,

Welcome to this post on visualizing Distribution Plots under Data Science & Machine Learning. In the previous post, we discussed about the installation process of Seaborn library for Data Visualization. In this post, we'll learn about distribution plots supported by Seaborn that allows us to visualize the distribution of a dataset.

Note: All the commands discussed below are run in the Jupyter Notebook environment. See this post on Jupyter Notebook to know about it in detail. 

Seaborn Distribution Plots

So, let's first import the useful libraries. 


I have imported NumPy library as well to generate random data to fill our plots with. Now, let's start with creating various plots using Seaborn.
  1. distplot : It is used to visualize the distribution of a univariate (one variable) data points. In the example below, first we generated a random NumPy array and then plot a distribution plot of the same using the Seaborn's distplot() method:


    What it returns is basically a histogram of data points and the dark blue line is called the KDE (Kernel Density Estimation). We can remove the KDE from our plot by setting the kde parameter to false.

    The y-axis represents the count of the data points in the range represented by x-axis. We can also change the bins parameter to get a detailed/abstract view of the data points. Generally, larger the bins value more detailed the distribution plot and smaller the bins value less detailed the distribution plot.
Share:

Sunday, 16 August 2020

Data Science & Machine Learning - 7.1 Seaborn & Its Installation

Hi friends,

Welcome to this post on Data Visualization under Data Science & Machine Learning. In the previous few posts, we discussed about the Matplotlib plotting library in Python for Data Visualization. In the next few posts, we'll learn about Seaborn, another powerful Python visualization library built on top of Matplotlib.

About Seaborn [1]

Seaborn is a powerful Python Data Visualization library for making informative statistical graphics in Python. It is built on top of Matplotlib and include support for NumPy and Pandas data structures and statistical routines from Scipy and Statsmodels.

Some of the features that Seaborn offers are

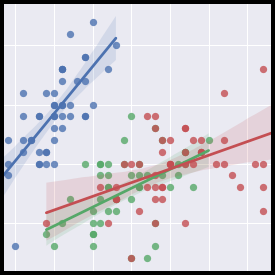
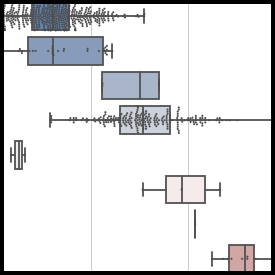
Here are some of the plots supported by the Seaborn library:

screenshots       screenshots

screenshots       screenshots

Image source: Seaborn

Seaborn Installation

Just like the installation of other Python Data Science libraries such as NumPy/Pandas/Matplotlib, it is recommended to use the Anaconda distribution of Python in order to install Seaborn as well. You can see the installation of Anaconda distribution of Python here. Once you have that installed, you can install Seaborn by running the following command in the command prompt:

conda install seaborn

You can still install Seaborn even if you don't have the recommended Anaconda distribution of Python (not recommended) using the following command:

pip install seaborn

You can see the list of various plots supported by Seaborn from this linkNow that we have installed Seaborn successfully on our systems, we will start using the Seaborn library starting with various plots for visualizing the distribution of a dataset from the next post.
Share:

Sunday, 15 October 2017

Programming Resources

I will keep editing the resources for other programming languages as well. 
Share:

Monday, 11 September 2017

Data Science & Machine Learning - 6.4 Matplotlib Plots Customization

Hi friends,

Welcome to this post on Matplotlib Plots Customization under Data Science & Machine Learning. In the previous post, we discussed how to draw subplots using Matplotlib. In this post, we will learn to customize (plot color, plot style, etc.) our plots.

Note: All the commands discussed below are run in the Jupyter Notebook environment. See this post on Jupyter Notebook to know about it in detail.

Matplotlib Plots Customization

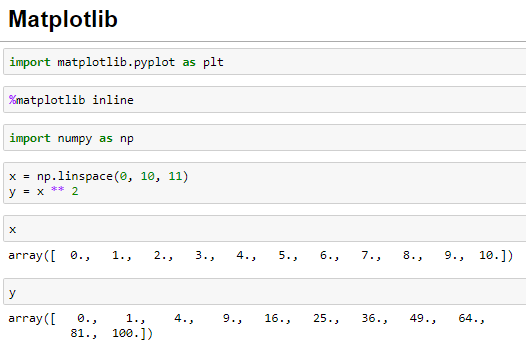
Let's first import the Matplotlib library and also recreate the NumPy Array we created in the previous post as the data for the plots. I suggest you to go through this post if you find any difficulties in any of the statements executed below:


Let's now create some plots with the Matplotlib:


Change the plot color

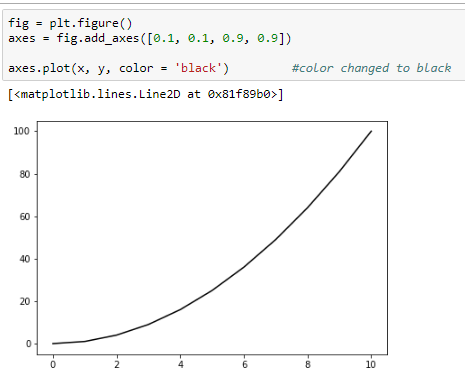
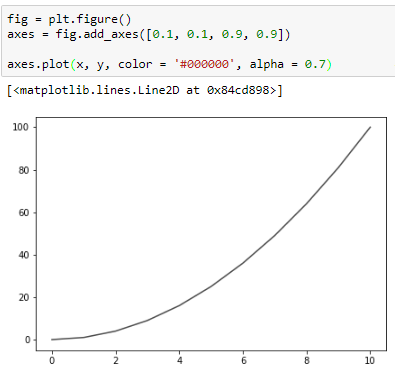
Matplotlib supports two ways (using the color name and the RGB hex code) of changing the color of the plot using the color parameter of the plot method. I have changed the plot color to black using these two ways in the below example:


Change the line opacity

We can also change the opacity of the line of the plot using the alpha parameter of the plot method. The higher the alpha value the more opaque the plot. I have set the opacity to 0.8 in the below example:

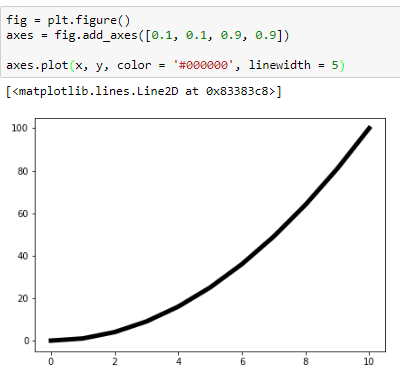
Change the line width

We can change the width of the line of the plot using the linewidth parameter of the plot method. I have changed the linewidth to five times the default line width in the below example:


Change the line style

Matplotlib also supports various line styles for the plots. These can be changed by the linestyle parameter of the plot method. Below is an example of the dashed line style supported by the plot method:


Here is a list of all the style types supported by the plot method:

['solid' | 'dashed' | 'dashdot' | 'dotted' | (offset, on-off-dash-seq) |  '-' | '--' | '-.' | ':' | 'None' | ' ' '']


Marker for the actual points

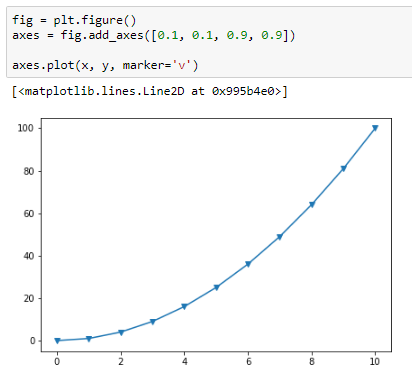
Matplotlib also supports marking actual points on the graph using the marker parameter of the plot() method. Here is an example of triangle down marker:


The following link lists all the marker types supported by the plot method. I also recommend visiting this awesome link which provides tons of other customization options we can do with Matplotlib. With this, we end this post on Matplotlib. From the next post onward, we'll learn about Seaborn, another very important Data Science library to plot beautiful statistical plots.
Share:

Saturday, 19 August 2017

Xtensor & Xtensor-blas Library - Numpy for C++

Xtensor & Xtensor-blas Library - Numpy for C++

Intro - What & Why?

I am currently working on my own deep learning & optimization library in C++, for my research in Data Science and Analytics Course at Maynooth University, Ireland. While searching for an existing tensor library (eigen/armadillo/trilinos - do not support tensors). I discovered Xtensor and Xtensor-blas, which has syntax like numpy and is avaliable for for C++ and Python.

Capabilities/Advantages (Xtensor to Numpy cheatsheet)

  • Numpy Like Syntax

    typedef xt::xarray<double> dtensor;
    
    dtensor arr1 {{1.0, 2.0, 3.0},   {2.0, 5.0, 7.0},   {2.0, 5.0, 7.0}}; // 2d array of double
    
    dtensor arr2 {5.0, 6.0, 7.0}; // 1d array of doubles
    
    cout << arr2 << "\n"; // outputs : {5.0, 6.0, 7.0}
  • Intuitive Syntax For Operation

    typedef xt::xarray<double> dtensor;
    
    dtensor arr1 {{1.0, 2.0, 3.0},   {2.0, 5.0, 7.0},   {2.0, 5.0, 7.0}}; // 2d array of double
    
    dtensor arr2 {5.0, 6.0, 7.0}; // 1d array of doubles
    
    cout << arr2 << "\n"; // outputs : {5.0, 6.0, 7.0}
    
    // Reshape
    arr1.reshape({1, 9});
    arr2.reshape({1,9});
    cout << arr1 << "\n"; // outputs : {1.0, 2.0, 3.0, 2.0, 5.0, 7.0, 2.0, 3.0, 7.0}
    
    // Addition, Subtraction, Multiplication, Division
    dtensor arr3 = arr1 + arr2;
    dtensor arr3 = arr1 - arr2;
    dtensor arr3 = arr1 * arr2;
    dtensor arr3 = arr1 / arr2;
    
    // Logical Operations
    dtensor filtered_out = xt::where(a > 5, a, b);
    dtensor var = xt::where(a > 5);
    dtensor logical_and = a && b;
    dtensor var = xt::equal(a, b);
    
    // Random numbers
    dtensor random_seed = xt::random::seed(0);
    dtensor random_ints = xt::random::randint<int>({10, 10});
    
    // Basic operations
    dtensor summation_of_a = xt::sum(a);
    dtensor mean = xt::mean(a);
    dtensor abs_vals = xt::abs(a);
    dtensor clipped_vals = xt::clip(a, min, max);
    
    // Exponential & Power Functions
    dtensor exp_of_a = xt::exp(a);
    dtensor log_of_a = xt::log(a);
    dtensor a_raise_to_b = xt::pow(a, b);
  • Easy Linear Algebra

    // Vector product
    dtensor dot_product = xt::linalg::dot(a, b)
    dtensor outer_product = xt::linalg::outer(a, b)
    
    // Inverse & solving system of equation
    xt::linalg::inv(a)
    xt::linalg::pinv(a)
    xt::linalg::solve(A, b)
    xt::linalg::lstsq(A, b)
    
    // Decomposition
    dtensor SVD_of_a = xt::linalg::svd(a)
    
    // Norms & determinants
    dtensor matrix_norm = xt::linalg::norm(a, 2)
    dtensor matrix_determinant = xt::linalg::det(a)

Installation

  • Install Xtensor
    cd ~ ; git clone https://github.com/QuantStack/xtensor
    cd xtensor; mkdir build && cd build;
    cmake -DBUILD_TESTS=ON -DDOWNLOAD_GTEST=ON ..
    make
    sudo make install
  • Install xtensor-blas
    cd ~ ; git clone https://github.com/QuantStack/xtensor-blas
    cd xtensor-blas; mkdir build && cd build;
    cmake ..
    make
    sudo make install

Use In Your Code

  • It is a header only library
    
    #include <xtensor/xarray.hpp>
    
    
    #include <xtensor/xio.hpp>
    
    
    #include <xtensor/xtensor.hpp>
    
  • Linking & Compilation flags
    g++ -std=c++14 ./myprog.cpp -lblas

Where have I used it?

As mentioned in the intro, Xtensor and Xtensor-blas are the core component on which I have built my own deep learning & optimization library. This library is a monumental shift in C++ and ease of computation. In upcoming series of posts I will show you how to create your own library using xtensor.

Next Post

In the next post, I will give an overview of the architecture of the project for your own library. And alongside I will introduce blas routines.
Share:

Contact Me

Name

Email *

Message *

Popular Posts