Hi friends,
Welcome to this post on Data Visualization under Data Science & Machine Learning. In the previous few posts, we discussed about the Matplotlib plotting library in Python for Data Visualization. In the next few posts, we'll learn about Seaborn, another powerful Python visualization library built on top of Matplotlib.
Welcome to this post on Data Visualization under Data Science & Machine Learning. In the previous few posts, we discussed about the Matplotlib plotting library in Python for Data Visualization. In the next few posts, we'll learn about Seaborn, another powerful Python visualization library built on top of Matplotlib.
About Seaborn [1]
Seaborn is a powerful Python Data Visualization library for making informative statistical graphics in Python. It is built on top of Matplotlib and include support for NumPy and Pandas data structures and statistical routines from Scipy and Statsmodels.
Some of the features that Seaborn offers are
- Several built-in themes for styling Matplotlib graphics
- Tools for choosing color palettes to make beautiful plots that reveal patterns in your data
- Functions for visualizing univariate and bivariate distributions or for comparing them between subsets of data
- Tools that fit and visualize linear regression models for different kinds of independent and dependent variables
- Functions that visualize matrices of data and use clustering algorithms to discover structure in those matrices
- A function to plot statistical timeseries data with flexible estimation and representation of uncertainty around the estimate
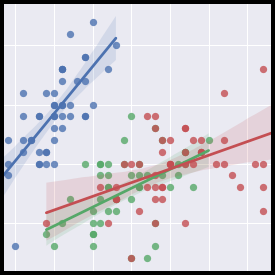
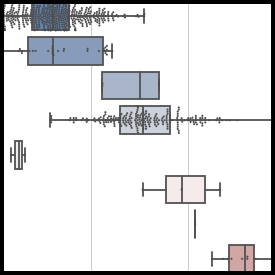
Here are some of the plots supported by the Seaborn library:


Image source: Seaborn
Seaborn Installation
Just like the installation of other Python Data Science libraries such as NumPy/Pandas/Matplotlib, it is recommended to use the Anaconda distribution of Python in order to install Seaborn as well. You can see the installation of Anaconda distribution of Python here. Once you have that installed, you can install Seaborn by running the following command in the command prompt:
You can still install Seaborn even if you don't have the recommended Anaconda distribution of Python (not recommended) using the following command:
You can see the list of various plots supported by Seaborn from this link. Now that we have installed Seaborn successfully on our systems, we will start using the Seaborn library starting with various plots for visualizing the distribution of a dataset from the next post.


Fascinating post. I Have Been considering about this issue, so thankful for posting. Totally cool post.It 's very generally very Useful post.Thanks
ReplyDeletehttps://360digitmg.com/course/certification-program-in-data-science
Seaborn is a Python data visualization library built on top of Matplotlib. It provides a high-level interface for creating attractive and informative statistical graphics. Seaborn is designed to make visualizations in Python easier and more attractive by default with several features like different color palettes, informative plots, and combinations with Pandas data structures directly.
DeleteMachine Learning Final Year Projects
Key Features of Seaborn
High-level interface: Simplifies the process of creating complex visualizations.
Integration with Pandas: Seamlessly works with Pandas DataFrames.
Attractive default styles: Produces visually appealing plots out-of-the-box.
Statistical graphics: Offers a variety of plots for statistical data exploration.
Customization options: Allows for fine-tuning plot aesthetics.
I am really appreciative to the holder of this site page who has shared this awesome section at this spot
ReplyDeletehttps://360digitmg.com/india/data-science-using-python-and-r-programming-in-delhi
Really Nice Information It's Very Helpful All courses Checkout Here.
ReplyDeletedata science course in pune
Great Post
ReplyDeletechatbot companies
conversational AI
AI chatbot
chatbot for banking
HR chatbot
IT helpdesk chatbot
Healthcare chatbot
Very useful blog,thanks for sharing.
ReplyDeletecheck below for Online MBA.
Innomatics Research Labs is collaborated with JAIN (Deemed-to-be University) and offering the Online MBA in Artificial Intelligence & Business Intelligence Program. It is a sublime program of getting an MBA degree from one of the best renowned university – JAIN University and an IBM certification program in Data Science, Artificial Intelligence, and Business Intelligence from Innomatics Research Labs in collaboration with Royal Society London.
Online MBA in Data Science
Online MBA in Business Analytics
Online MBA in Business Intelligence
This post is very simple to read and appreciate without leaving any details out. Great work!
ReplyDeleteai course aurangabad
Awesome article, it was extraordinarily helpful! I'm just getting started and I'm getting better at it!
ReplyDeleteMachine Learning Training in Bangalore
Java Full Stack Online Training
sharing a very nice blog: visit for more details www.nearlearn.com
ReplyDeleteThanks, dear for sharing this post with me because this blog is really helpful and informative for me Thanks
ReplyDeleteOnline Master Degree in USA
Online MBA Program in India