
Hi friends,
Welcome to this post on Matplotlib Plots Customization under Data Science & Machine Learning. In the previous post, we discussed how to draw subplots using Matplotlib. In this post, we will learn to customize (plot color, plot style, etc.) our plots.
Note: All the commands discussed below are run in the Jupyter Notebook environment. See this post on Jupyter Notebook to know about it in detail.


Here is a list of all the style types supported by the plot method:
['solid' | 'dashed' | 'dashdot' | 'dotted' | (offset, on-off-dash-seq) | '-' | '--' | '-.' | ':' | 'None' | ' ' | '']
Note: All the commands discussed below are run in the Jupyter Notebook environment. See this post on Jupyter Notebook to know about it in detail.
Matplotlib Plots Customization
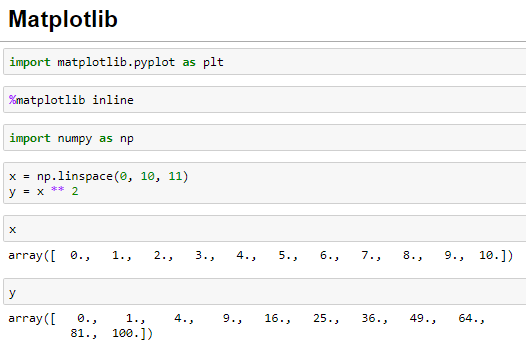
Let's first import the Matplotlib library and also recreate the NumPy Array we created in the previous post as the data for the plots. I suggest you to go through this post if you find any difficulties in any of the statements executed below:
Let's now create some plots with the Matplotlib:
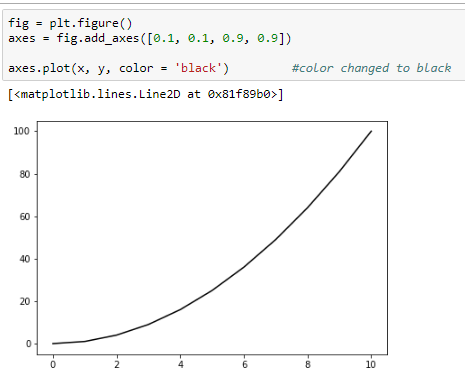
Change the plot color
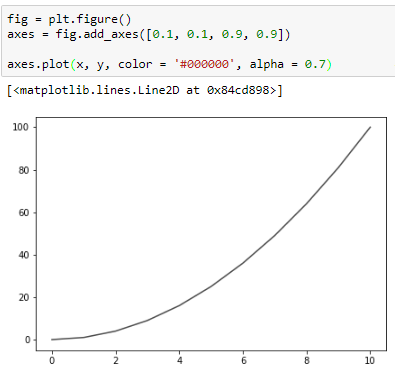
Matplotlib supports two ways (using the color name and the RGB hex code) of changing the color of the plot using the color parameter of the plot method. I have changed the plot color to black using these two ways in the below example:
Change the line opacity
We can also change the opacity of the line of the plot using the alpha parameter of the plot method. The higher the alpha value the more opaque the plot. I have set the opacity to 0.8 in the below example:
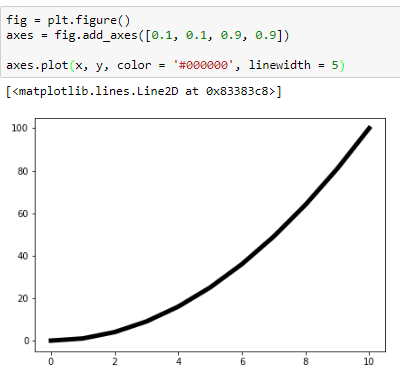
Change the line width
We can change the width of the line of the plot using the linewidth parameter of the plot method. I have changed the linewidth to five times the default line width in the below example:
Change the line style
Matplotlib also supports various line styles for the plots. These can be changed by the linestyle parameter of the plot method. Below is an example of the dashed line style supported by the plot method:
Here is a list of all the style types supported by the plot method:
['solid' | 'dashed' | 'dashdot' | 'dotted' | (offset, on-off-dash-seq) | '-' | '--' | '-.' | ':' | 'None' | ' ' | '']
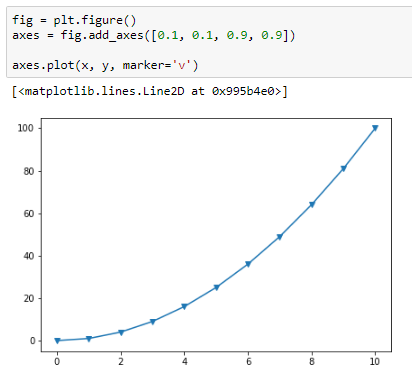
Marker for the actual points
Matplotlib also supports marking actual points on the graph using the marker parameter of the plot() method. Here is an example of triangle down marker:
The following link lists all the marker types supported by the plot method. I also recommend visiting this awesome link which provides tons of other customization options we can do with Matplotlib. With this, we end this post on Matplotlib. From the next post onward, we'll learn about Seaborn, another very important Data Science library to plot beautiful statistical plots.

This video helps me to understand Matplotlib whats your opinion guys.
ReplyDeletereat
DeleteAbsolutely! Matplotlib offers a wide range of customization options to tailor your plots exactly how you want them. Here's a breakdown of some key areas for customization:
DeleteMachine Learning Projects for Final Year
1. Colors & Styles:
Line Colors & Styles: Use the color and linestyle arguments within the plotting function (e.g., plot) to define line colors (e.g., 'red', 'blue') and styles (e.g., '-', '--', ':').
Markers: Choose different marker styles (e.g., 'o' for circles, 's' for squares) using the marker argument. You can also customize marker size and color.
Fill Between Lines: For area plots, utilize fill_between to create shaded regions between lines, defining the fill color with the color argument.
eCommerce POS Integration: Making Your Retail Business Omnichannel-Ready
ReplyDeleteComparing Odoo and Zoho For Enterprise-based LMS Software Development
Logistics Management Software Solutions For The Supply Chain
Odoo Hubspot Integration Services
Odoo ERP development for Hospital Management
Odoo 12: Explore what it stores for Mobile ERP Application Development
Very useful blog,thanks for sharing.
ReplyDeletecheck below for Online MBA.
Innomatics Research Labs is collaborated with JAIN (Deemed-to-be University) and offering the Online MBA in Artificial Intelligence & Business Intelligence Program. It is a sublime program of getting an MBA degree from one of the best renowned university – JAIN University and an IBM certification program in Data Science, Artificial Intelligence, and Business Intelligence from Innomatics Research Labs in collaboration with Royal Society London.
Online MBA in Business Intelligence
Online MBA in Business Analytics
Online MBA in Data Science
Great post. I found very useful info from this post. Thank you very much.
ReplyDeleteAre you believing that a Mobile App Ideas is costly? The App Ideas is leading web and Mobile App development. We provide the best IT Services at best rates. Contact us now!