
Hi friends,


Welcome to another post on Matplotlib under Data Science & Machine Learning. In the previous post, we discussed the installation process of Matplotlib. In this we will see the basic plots supported by Matplotlib.
Note: All the commands discussed below are run in the Jupyter Notebook environment. See this post on Jupyter Notebook to know about it in detail.
Matplotlib Basic Plots
Before we can begin to use the Matplotlib library, we need to import it using the following command:
Although this will import the Matplotlib library in Python yet we need to run the following additional command in order for the plots to be displayed inside the Jupyter Notebook:
This requests the Jupyter Notebook to display the plots inline i.e. within the Jupyter Notebook.
First, I have generated a NumPy Array of random numbers using the linspace method which will be used to draw the plots.
Let's now draw some plots using the Matplotlib library.
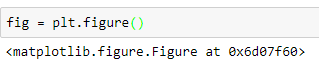
In the above figure, we have created a figure object (fig) using figure() method which renders a FigureCanvas (an empty background) to draw plots on using the Matplotlib library. Next, we add axes to the fig object created above using the add_axes() method:
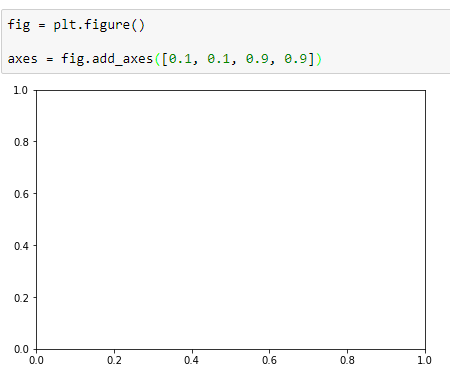
The add_axes() method takes a list (with four elements) as a parameter signifying the left point, the bottom point, the width and the height respectively of the axes. You can pass in any values within the range [0, 1] for each of the parameters.
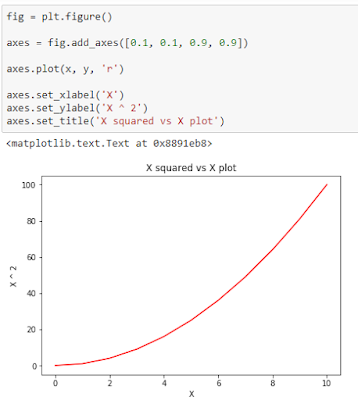
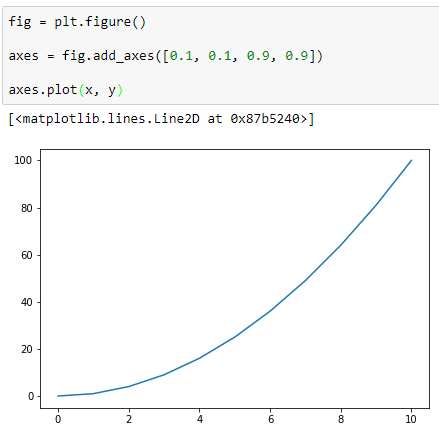
Next, we plot the above generated NumPy arrays on our axes using the plot() method:

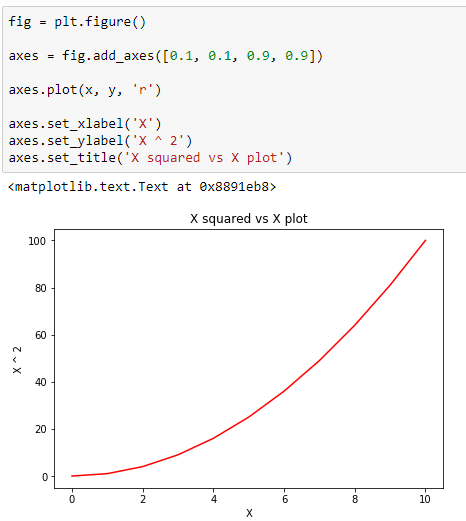
Now, we can do several customization to our plot such as adding x and y labels, adding the plot title or changing the plot color:
We can also add multiple axes to the same plot. Here is an example of two axes within a figure object:

We can do similar customization as before by calling the required method on the appropriate axis object as shown below:

I have only discussed the object-oriented way of using Matplotlib here. You can also use the Matplotlib using the functional method by going through this official documentation. I however like the object-oriented way better since it provides flexibility and controlled way of usage. In the next post, we will discuss how to draw subplots inside the figure canvas and other advance features of Matplotlib library.
The add_axes() method takes a list (with four elements) as a parameter signifying the left point, the bottom point, the width and the height respectively of the axes. You can pass in any values within the range [0, 1] for each of the parameters.
Next, we plot the above generated NumPy arrays on our axes using the plot() method:
Now, we can do several customization to our plot such as adding x and y labels, adding the plot title or changing the plot color:
We can also add multiple axes to the same plot. Here is an example of two axes within a figure object:

We can do similar customization as before by calling the required method on the appropriate axis object as shown below:
I have only discussed the object-oriented way of using Matplotlib here. You can also use the Matplotlib using the functional method by going through this official documentation. I however like the object-oriented way better since it provides flexibility and controlled way of usage. In the next post, we will discuss how to draw subplots inside the figure canvas and other advance features of Matplotlib library.

Matplotlib is an excellent tool for creating basic plots in Python, making data visualization easy and efficient. For gamers exploring hekate switch, you can visualize your gaming data or system stats with Matplotlib to track performance or usage trends
ReplyDelete